

As inflation takes its toll on household budgets, asset reserves will make all the difference. How will those who do not possess them manage? There is an urgent need to address the measure of this structural inequality across social classes and age groups.
|
The current surge in inflation is forcing the working classes to dip into their savings, if available, to cover their daily expenses [1]. In addition to the consumption capacities tied to revenues, it is also draining their often limited savings, which are all the more exposed as they are deposited in low-yielding accounts. In this context, it is important to study the wealth accumulated by households, as it is a buffer against economic shocks, which is why the value of housing is not taken into account, even though ownership of the main residence also contributes to inequality (Bugeja-Bloch, 2013). Moreover, housing carries a greater share of the budget for lower-income households and is an incompressible expense (Cusset, Prada-Aranguren, Trannoy, 2021). The study of wealth and of its contribution to the social structure usually focuses on well-off households. While Piketty has eloquently shown why wealth matters as much in the upper echelons of society, this is also the case at the lower end of the social ladder. In a society that (re)places great importance on wealth, not possessing it places the households affected in a situation of social inferiority and economic vulnerability. Our aim is to identify which groups are exposed to this lack of wealth.
For this purpose, we mobilise a large-scale statistical source, largely unexploited by researchers—the Household Financial and Consumption Survey developed by the European Central Bank (Box 1). It is the only European-wise survey that integrates data on household assets, thereby making it possible to develop a measure of economic vulnerability, asset-based poverty, already mobilised by the Organisation for Economic Co-operation and Development (OECD). Asset poverty is defined as holding insufficiant liquid asset reserves (immediately available) [2] to maintain a living standard equivalent to the poverty line for at least three months (OECD, see Balestra and Tonkin, 2018).
The analysis of asset poverty by social class and age enables us to measure the extent of economic vulnerability, to identify its most concentrated zones, and question the criteria for analysing social classes as well as comparing levels of inequality between European societies.
Box 1: Data source
To perform a joint analysis of wealth, income, social class, and age in different European countries, we mobilised data from the European Central Bank’s Household Financial and Consumption Survey. Conducted in 2017, the third wave of the survey was based on a representative sample of the population of 22 European countries. It should be noted that these surveys are criticised, by Piketty in particular, for their relative lack of reliability if compared to administrative sources, especially for high levels of assets. Small sample sizes, as well as missing values, could also raise concerns. Nevertheless, as wealthy households were over-represented in the survey and, more fundamentally, we are interested in the bottom half of social structure, the gaps we measure are less sensitive to a potential underestimation of substantial wealth.
To address the problems associated with small samples, we restricted the analysis to five countries representative of major social systems (Esping-Andersen, 1999) with substantial numbers of respondents: Finland (10 210) for the social democratic countries in Northern Europe; France (13 685) and Germany (4 942) for the continental European countries where insurance plays a predominant role in their social model; Spain (6 413) for the Mediterranean countries where family plays a vital role in the social compromises; and Ireland (4 793) as a model close to the United Kingdom in terms of the importance attached to the market. We used the European Socio-economic Groups (ESeG) to code social classes and compared their distributions in the working population with other surveys (Labor Force Survey, 2011; Adult Education Survey, 2011). No significant distortions or discrepancies were found based on the above comparison.
Context
This article builds on previous research on social insecurity (Duvoux et Papuchon, 2018), defined as an inability to project oneself positively into the future. Based on a measure of subjective poverty, the research revealed the extension of a form of social insecurity to categories commonly considered immune to monetary poverty: certain segments, particularly workers and employees in the working classes, but also the self-employed and non-proprietary pensioners. One of the results of this research was to highlight the interaction effects between certain statuses (of retirees, for example) and the possession of assets. While retirees in France are relatively well protected from monetary poverty, taking into account housing tenure status sheds light on the feeling of poverty among retired tenants, a feeling associated with a negative perception of one’s past and future social trajectory, firmly rooted in deteriorated material living conditions.
These results stress the importance of the patrimonial middle class (defined by Thomas Piketty (2013) as the individuals placed between the richest 10% and the poorest 50%) in the structuring of today’s society, as opposed to that of the beginning of the twentieth century. The latter was characterised by a very high concentration of wealth, and even more so in the large cities, where the small peasant property could not, by construction, temper the concentration observed. The approach to poverty and inequality, which focuses on their subjective and temporal dimensions, has therefore been extended by reassessment of the typology of social classes in terms of wealth (Duvoux et Papuchon, 2022) and of how it could structure expectations, possibilities, and accumulation expectations or, on the contrary, diminished prospects, depending on different class or age.
By mapping out liquid wealth (defined as total net wealth excluding property and vehicles), i.e. the savings effectively available to cope with a significant economic shock (unemployment, separation, accident, etc.), we were able to develop a measure of the relative protection provided by such liquid assets compared to income. Table 1 demonstrates how many months of income such liquid assets are equivalent to for each age and class group in the five European countries selected (data from the 2014 wave). The green zone represents a form of security, the white zone an intermediate situation and the orange zone a form of fragility.
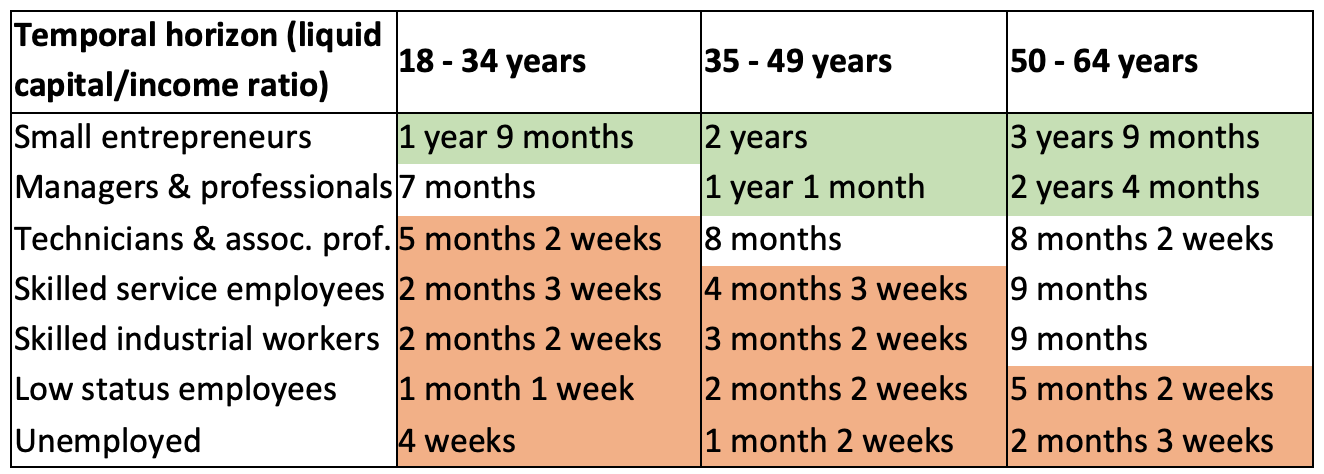
Table 1
Population: People in the labor force aged 18 years or older living in Germany, Finland, Metropolitan France, Ireland, or Spain, HFCS 2, 2014 wave.
Source : Duvoux et Papuchon, 2022
Source : Duvoux et Papuchon, 2022
The identification of this zone of fragility is consistent with OECD’s measure of asset poverty. Asset poverty is defined as an individual in a household whose liquid assets are insufficient to maintain oneself for at least three months above the income poverty line, which the OECD defines as half of the median household income for the whole population of the country concerned [3].
The liquid assets taken into account are the total liquid financial resources of the household (deposits, shares, etc.), from which is subtracted the value of non-collateral debts (overdraft and credit debts, non-mortgage loans) [4]. As for income, all measures refer to total gross household income that is available in the database for all the countries selected.
This makes it possible to establish a three-level classification: households that are ‘income poor only’ (G1); those that are not income poor but are asset poor according to the above criterion are considered to be ’economically vulnerable’ (G2). Lastly, those in both types of poverty are classified as ‘asset and income poor’ (G3). ‘Income poverty’ includes therefore group 1 and 2.
‘Asset poverty’ is the general category studied in this paper, and brings together two sub-populations: those who are asset poor but not income poor, who are ‘only’ economically vulnerable (Group 2); those who combine these two forms of fragility (Group 3). The economic vulnerability indicator, defined as households that are asset poor, but not income poor, offers an indication of the size of the populations situated in the upper halo of income poverty but still exposed to a hazard or shock.
Economic vulnerability by age and social class
Figure 1 shows that at the country level, the proportion of households in economic vulnerability is significantly higher (between 30% and 40%) than that in income poverty, which accounts for around 20% of households in all five countries except France (15%). Ireland has the highest level of relative income poverty and economic vulnerability: 22% of households are income poor, while a further 43% do not have sufficient liquid assets to maintain a living standard above the poverty line for at least three months. Finland, a Nordic country known for its egalitarian welfare model, comes second, with 39% of households in economic vulnerability, a result consistent with findings that Nordic countries are often more unequal than continental European countries in terms of wealth (Waitkus et Pfeffer, 2021). Asset poverty, which includes households that cumulatively experience both forms of poverty, is even more widespread, affecting almost or more than half of all households. These results are consistent with the orders of magnitude of OECD’s measure of asset poverty.

Figure 1 Percentage of households in income poverty and asset poverty
Note: In Germany, 14.8% of working population are asset and income poor (G3), 6.5% are income poor only (G1), and 31.9% are economically vulnerable (G2), i.e. asset poor only. Income poverty (G1+G3) in Germany amounts to 21.3% and asset poverty (G2+G3) to 46.7%.
Population: working population in Germany, Spain, Finland, France, Ireland
Source: HFCS 3, 2017 wave.
Population: working population in Germany, Spain, Finland, France, Ireland
Source: HFCS 3, 2017 wave.

Figure 2 Asset-based poverty at household level by age and country
Note: 67.4% of 18-34 years olds in Finland are asset poor, 59.6% for 35-49 years olds and 53.1% for 50-64 years olds
Population: working population in Germany, Spain, Finland, France, Ireland
Source: HFCS 3, 2017 wave
Population: working population in Germany, Spain, Finland, France, Ireland
Source: HFCS 3, 2017 wave
In all socio-professional categories, asset poverty is considerably more widespread than income poverty (Figure 3). Mirroring the results established via the wealth-income ratio (Duvoux et Papuchon, 2022), there are significant differences between managers and technicians on the one hand (30% and 44% asset poor, respectively), and lower-skilled employees and workers, as well as the unemployed, on the other (from 60% to 77% asset poor). Small entrepreneurs, whose socio-economic profile is more heterogeneous than that of wage earners as it includes independent earners of various scales [5], remain a specific group, in a third position vis-à-vis capital and labour.
The articulation of the two types of poverty also reveals this social hierarchy (Figure 3). While 10% of the small entrepreneurs are affected by the cumulative effect of the two forms of poverty, this is also the case for 4% of professionals and between 6% and 7% of technicians and associate professionals, as well as skilled service employees and industrial workers. The figures are higher for low status employees (18%) and even more for the unemployed (40%).
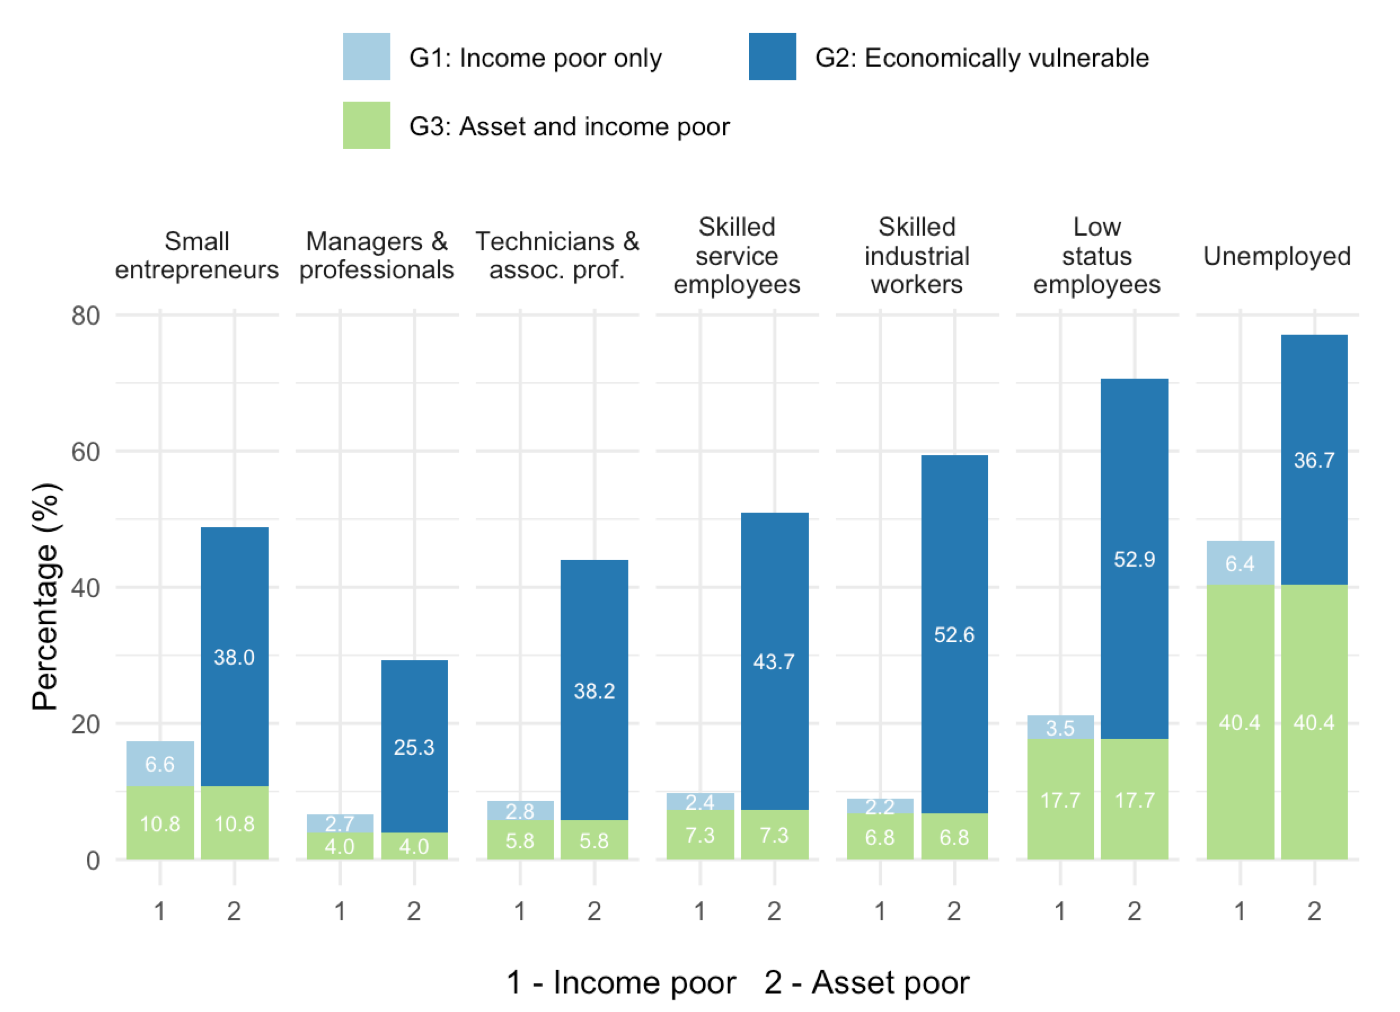
Figure 3: Income poverty and asset poverty by class
Note: 9.7% of skilled employees are income poor, and 51% asset poor.
Population: working population in Germany, Spain, Finland, France, Ireland
Source: HFCS 3, 2017 wave
Population: working population in Germany, Spain, Finland, France, Ireland
Source: HFCS 3, 2017 wave
Wealth and income inequality patterns are also found throughout the life course (Figure 4). Crossing the two sets of information reveals several cleavages. Although it is necessary to be cautious as only net liquid assets are taken into consideration, in terms of asset poverty, young people (18-34 years old) and intermediates (35-49 years old) share the same level of economic vulnerability, in contrast to older working populations who have been able to accumulate savings as a buffer. For income poverty, the most noticeable gap seperates the young from the other two age groups. As far as the accumulation of the two forms of poverty (asset and income poor) is concerned, the sharpest divide is between the under-35s and the others. Overall, as people advance in age – insofar as the three age groups make it possible to capture this advance – it is firstly income poverty that decreases (between the 18-34 and 35-49 age groups) and then asset poverty. The relevance of the asset poverty indicator is to reveal the scope of the constellation concerned by the absence of liquid reserves, which may go hand in hand with indebtedness for purchasing the main residence.
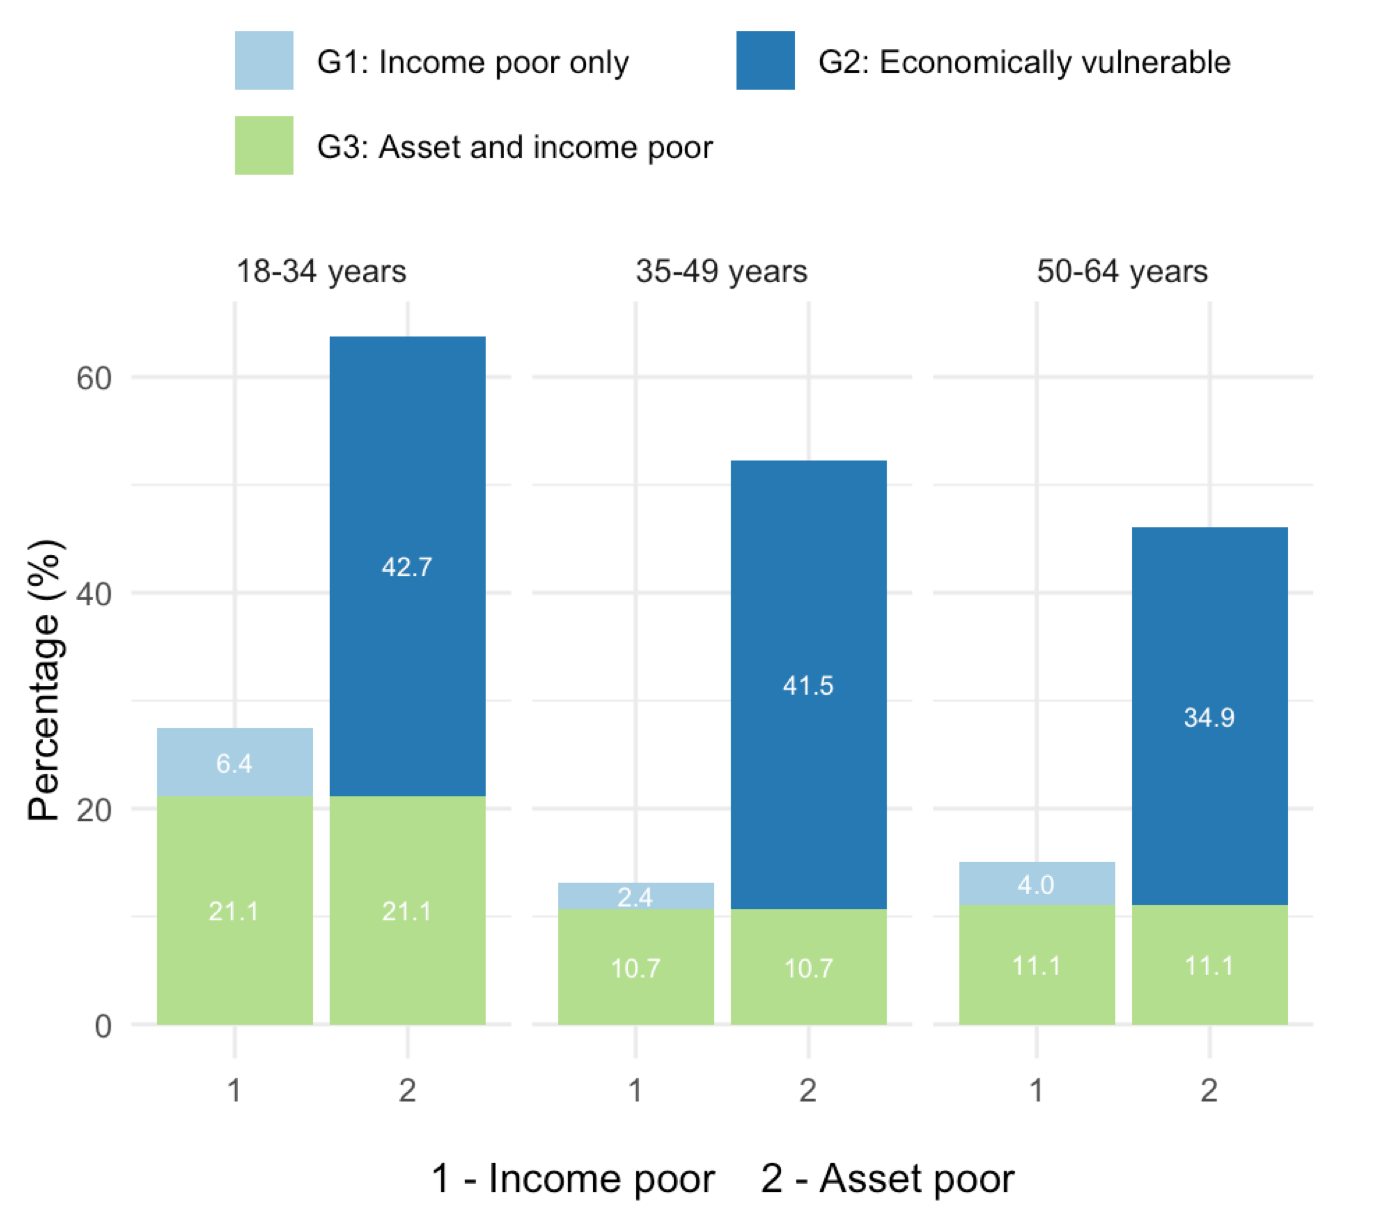
Figure 4 Income and/or asset poverty by age
Note: 21.1% of 18-34 years olds are income and asset poor, 6.4% income poor only, and 42.7% economically vulnerable
Population: working population in Germany, Spain, Finland, France, Ireland
Source: HFCS 3, 2017 wave
Population: working population in Germany, Spain, Finland, France, Ireland
Source: HFCS 3, 2017 wave
When examining asset poverty in detail by occupational category and by age group (Figure 5), we can identify an extreme inequality that confirms the previous results. Asset poverty intensifies as one moves further down the social ladder and becomes less pronounced with age, with the previously mentioned notable exception of small entrepreneurs. There is a gap of 65 percentage points between older managers (23%) and young unemployed individuals (88%), an inequality that is even more pronounced than the one observed in terms of income poverty.

Figure 5 Asset poverty at household level by age and class
Note: Among skilled service employees, 69.8% of 18-34 years olds, 48% of 35-49 years olds and 47.9% of 50-64 years olds are asset poor
Population: working population in Germany, Spain, Finland, France, Ireland
Source: HFCS 3, 2017 wave
Population: working population in Germany, Spain, Finland, France, Ireland
Source: HFCS 3, 2017 wave
The implications of this research
This study highlights three key aspects. The first is the importance of taking wealth into consideration in the discussion of inequalities in general and class inequalities in particular. While it has been shown that wealth is an important criterion of ethno-racial inequalities in the United States (Oliver, Shapiro, 1995) and of gender inequalities in France (Bessière, Gollac, 2020), attempts to systematically articulate the level of wealth ownership and one’s social class have not yet been explored to the same extent as how important wealth is for inequalities between social groups.
Nowadays, it is either considered as one criterion among others, or rejected in favour of social hierarchy approaches centred on the sole criterion of wealth. In fact, some sociologists such as Mike Savage or Adkins, Cooper and Konings (2020) in Australia propose to integrate wealth into the analysis of classes, even seeking to put forward a typology of these classes based on wealth alone. We believe that occupational status remains a determining factor, but it must be analyzed in conjunction with levels of economic resources, which, in the case of wealth, results in considering differentiation based on one’s position in the life cycle.
To understand class, we must pay joint attention to both labour and wealth. This may be regarded as a truism with regard to the classical analyses of social classes centered on the conflict between capital and labour. Nevertheless, it implies liberating oneself from cumbersome disciplinary boundaries, as illustrated by the small amount of research crossing these dimensions. Moreover, wealth is now more widely distributed, at least to a ’patrimonial middle class’ (Piketty, 2013). Measuring economic vulnerability precisely enables us to mark the limits of this secular process of democratising access to wealth and to identify the categories placed in a vulnerable situation due to the renewed role of wealth in the class structure (Chauvel et al., 2021).
The second implication lies in the question of how relevant it is to provide a high figure for the economically vulnerable population. In France, asset poverty concerns 46% of the population, 36% of whom are economically vulnerable and 10% in both income and asset poverty. Is this figure excessive? Beyond the precise number, the order of magnitude is significant. It is not, however, inconsistent with other indicators. Recent studies seek to circumscribe the forms of accumulation between different dimensions of poverty (Blasco, Picard, 2021) and result, by construction, in more restrictive visions of social disadvantage. In contrast, our approach emphasizes the existence of a threshold of fragility around the 4th decile of the population. As outlined by Michèle Lelièvre, several studies concur on the point that material difficulties, exposure to economic circumstances, and the weight of constrained expenses in the budgets are particularly strong up to these levels (Duvoux et Lelièvre, 2021, p.140).
Thirdly, there are changes in the conventional comparisons of societies, particularly in Europe, where classical typologies of countries continue to be used as references. As shown by the case of Finland in our study, but also by the case of Sweden in more systematic comparisons (Pfeffer et Waitkus, 2021), the levels of income inequality and social protection that generally underpin the construction of welfare state models are not aligned with those of wealth inequality. The differentiation between egalitarian northern European models, intermediate continental European models and southern European models with a low level of protection needs to be supplemented by an examination of the public and private buffers provided by social ownership (Castel, 1995) of the state or insurance on the one hand and private ownership on the other. This is particularly relevant given that social state reforms open up spaces for leveraging private savings to mitigate shocks or maintain living standards in retirement. Our study highlights France’s favourable position in international comparisons in terms of asset poverty as well as income poverty, which does not alter the massive scope of economic vulnerability and, more importantly, asset poverty.
Conclusion
This article proposes to reassess rather radically the levels of diffusion of social difficulties measured in different countries. Taking wealth into consideration not only at the top but also at the bottom of society offers a better perspective on the extent of social insecurity. This is particularly the case in countries such as France, which have managed to limit income poverty through state intervention. Such an approach also suggests that we should question what for us seems obvious in the ranking of countries by their greater or lesser degree of inequality.
Measuring inequality in this way also helps to capture the permanence of class inequalities. Differences in exposure to economic insecurity are one way of measuring them and one that has the advantage of broadening the spectrum of criteria taken into account. Undoubtedly, several pieces of information should be integrated to analyse a social position. It is not possible to do everything with the data we have mobilised. However, at the very least, the socio-professional group, wealth, income and age are all salient elements, all of which indicate that they play a role in a society that, whilst remaining a wage-earning society, is nevertheless once again marching towards a wealth-owning society.
by & , 14 September 2022
Share this article
Find us here :


Further reading
References :
Adkins, L., Cooper, M., Konings, M. (2020), The Asset Economy: Property Ownership and the New Logic of Inequality, Cambridge, UK: Polity Press.
Andersen, G.E., The Three Worlds of Welfare Capitalism, Princeton, Princeton University Press.
Balestra, C., Tonkin, R. (2018), « Inequalities in household wealth across OECD countries : Evidence from the OECD Wealth Distribution Database », OECD Statistics Working Papers, 2018/1.
Bessière, C., Gollac, S. (2020), Le genre du capital. Comment la famille reproduit les inégalités, Paris, La Découverte.
Blasco, J., Picard, S. (2021), « Environ 2 millions de personnes en situation de grande pauvreté en France en 2018 », Insee Références, Revenus et patrimoine des ménages, p.55-75.
Bugeja-Bloch, F. (2013), Logement, la spirale des inégalités. Une nouvelle dimension de la fracture sociale et générationnelle, Paris, Puf.
Castel, R. (1995), Les métamorphoses de la question sociale. Une chronique du salariat, Paris, Fayard.
Chauvel, L., Bar Haim, E., Hartung, A., Murphy, E. (2021), « Rewealthization in twenty-first century Western countries: the defining trend of the socio-economic squeeze of the middle class, The Journal of Chinese Sociology, 4, published 11 January.
Cusset, P.Y., Aranguren, A.G., Trannoy, A. (2021), « Les dépenses pré-engagées : près d’un tiers des dépenses des ménages en 2017 », France stratégie, La note d’analyse, n°102.
Duvoux, N., Papuchon, A. (2018), « Qui se sent pauvre en France ? Pauvreté subjective et insécurité sociale », Revue française de sociologie, n°4, p.607-647.
Duvoux, N., Papuchon, A. (2022), « Class and relative wealth accumulation in five european countries. Sociological lessons from the HFCS (wave 2) », European Journal of Sociology.
Duvoux, N., Lelièvre, M. (2021), « Trajectoires et parcours des personnes en situation de pauvreté et d’exclusion sociale », Actes du séminaire DREES-Comité scientifique du CNLE.
Oliver, M, Shapiro, T.M.(1995), Black Wealth / White Wealth: A New Perspective on Racial Inequality, Taylor and Francis.
Pfeffer, F., Waitkus, N. (2021), « The wealth inequality of nations », American Sociological Review, 36.
Piketty, T. (2013), Le capital au XXIe siècle, Paris, Seuil.
To quote this article :
Nicolas Duvoux & Senmiao Yang, « Classes without wealth . Asset-based poverty and economic vulnerability », Books and Ideas , 14 September 2022. ISSN : 2105-3030. URL : https://booksandideas.net/Classes-without-wealth
Nota Bene:
If you want to discuss this essay further, you can send a proposal to the editorial team (redaction at laviedesidees.fr). We will get back to you as soon as possible.
You might also like


Footnotes
[1] We would like to thank Adrien Papuchon for his contribution to the reflection that led to this study, for his technical support and for his proofreading of the draft versions of this article.
[2] “The concept of liquid financial assets (i.e. cash, quoted shares, mutual funds and bonds net of liabilities of own unincorporated enterprises) is the main measure (…) as this represents the assets which are relatively accessible by households if needed urgently” (p. 62). The paper also provides a comparison between asset-based poverty measured by liquid assets and by net wealth: “When net wealth is used, measures of asset based poverty are around 2/3 lower than those based on the liquid financial wealth concept.” Balestra and Tonkin, 2018, p. 62-63.
[3] It should be pointed out that the poverty line used by INSEE is higher (60%, instead of 50% of the median standard of living), which implies that our measure of insecurity is intentionally restrictive.
[4] Property or rental investments are therefore not taken into account here. A household whose assets are mainly made up of real estate can thus be considrered as asset poor according to this indicator, without being impoverished. A household considered to be asset poor but heavily in debt may nevertheless have liquidity researves that can be mobilised against a temporary crisis. These two remarks are possible explanations for the significant levels of asset poverty described below, including among managers and professionals.
[5] One of the reasons for taking into account assets is precisely to highlight the wide dispersion of the self-employed, a group split between the ‘new app workers’, as Sarah Abdelnour and Dominique Méda put it, on the one hand, and the ‘large-scale grain farmers’, but also notaries, lawyers and other professions that require substantial assets to gain a foothold. Nevertheless, it should be noted that in the European socio-professional nomenclature (ESeG), the two groups - small entrepreneurs and the unemployed - do not have the same level of precision in occupational categorisation as wage earners. The latter are classified into five categories according to the ESeG classification, which, after harmonisation between European countries, took into account a series of criteria, including economic sectors, level of qualification and specialisation, occupational positions, etc. The absence of these criteria, which reflect to some extent the social stratification, among small entrepreneurs and the unemployed leads to a loss of information and nuance; hence the difficulty in identifying a coherent hierarchy observed among employees.
Our partners


Sections
Keep in touch
© laviedesidees.fr - Any replication forbidden without the explicit consent of the editors. - Mentions légales - webdesign : Abel Poucet